Beta
Lightweight offline dashboards for your school
In beta now
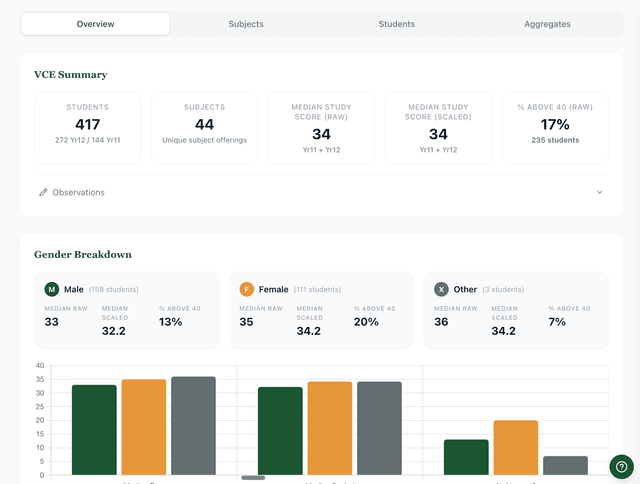
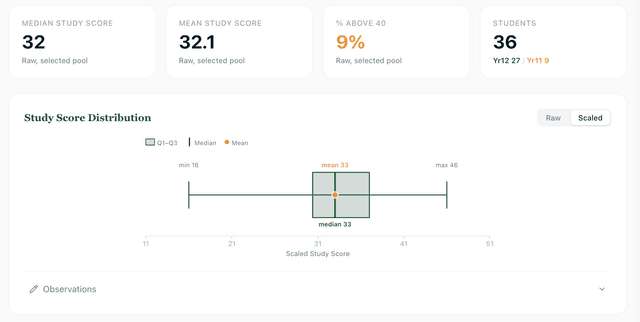
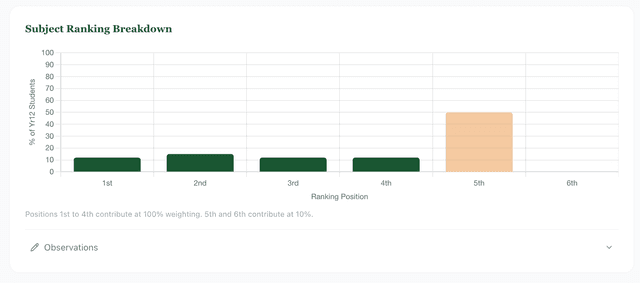
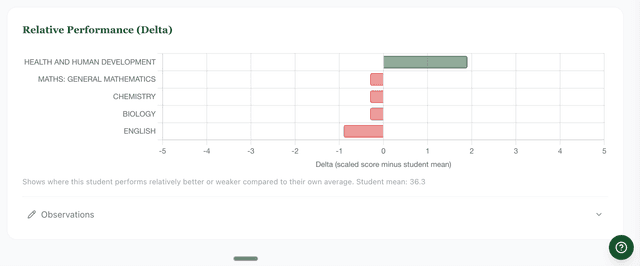
Two desktop apps, one for NAPLAN and one for VCE. Open the app, point it at the export you already download, and it builds the analysis: results against the state, cohort and subject breakdowns, growth over time, and item-level detail.
It is built to be more than charts. You can record your observations straight into the dashboard as you read it, and every graph comes with a short explainer on what it shows and how to read it, so a team meeting doubles as data-literacy PL rather than needing me in the room.
Everything runs locally, so student data never leaves the laptop, and it works on Mac and Windows.
Comments
No comments yet. If you've got a view on this one, you'll be the first.